Grafana
Grafana is an open-source data visualization / dashboard solution that is able to read data from a wide variety of sources, including Prometheus.
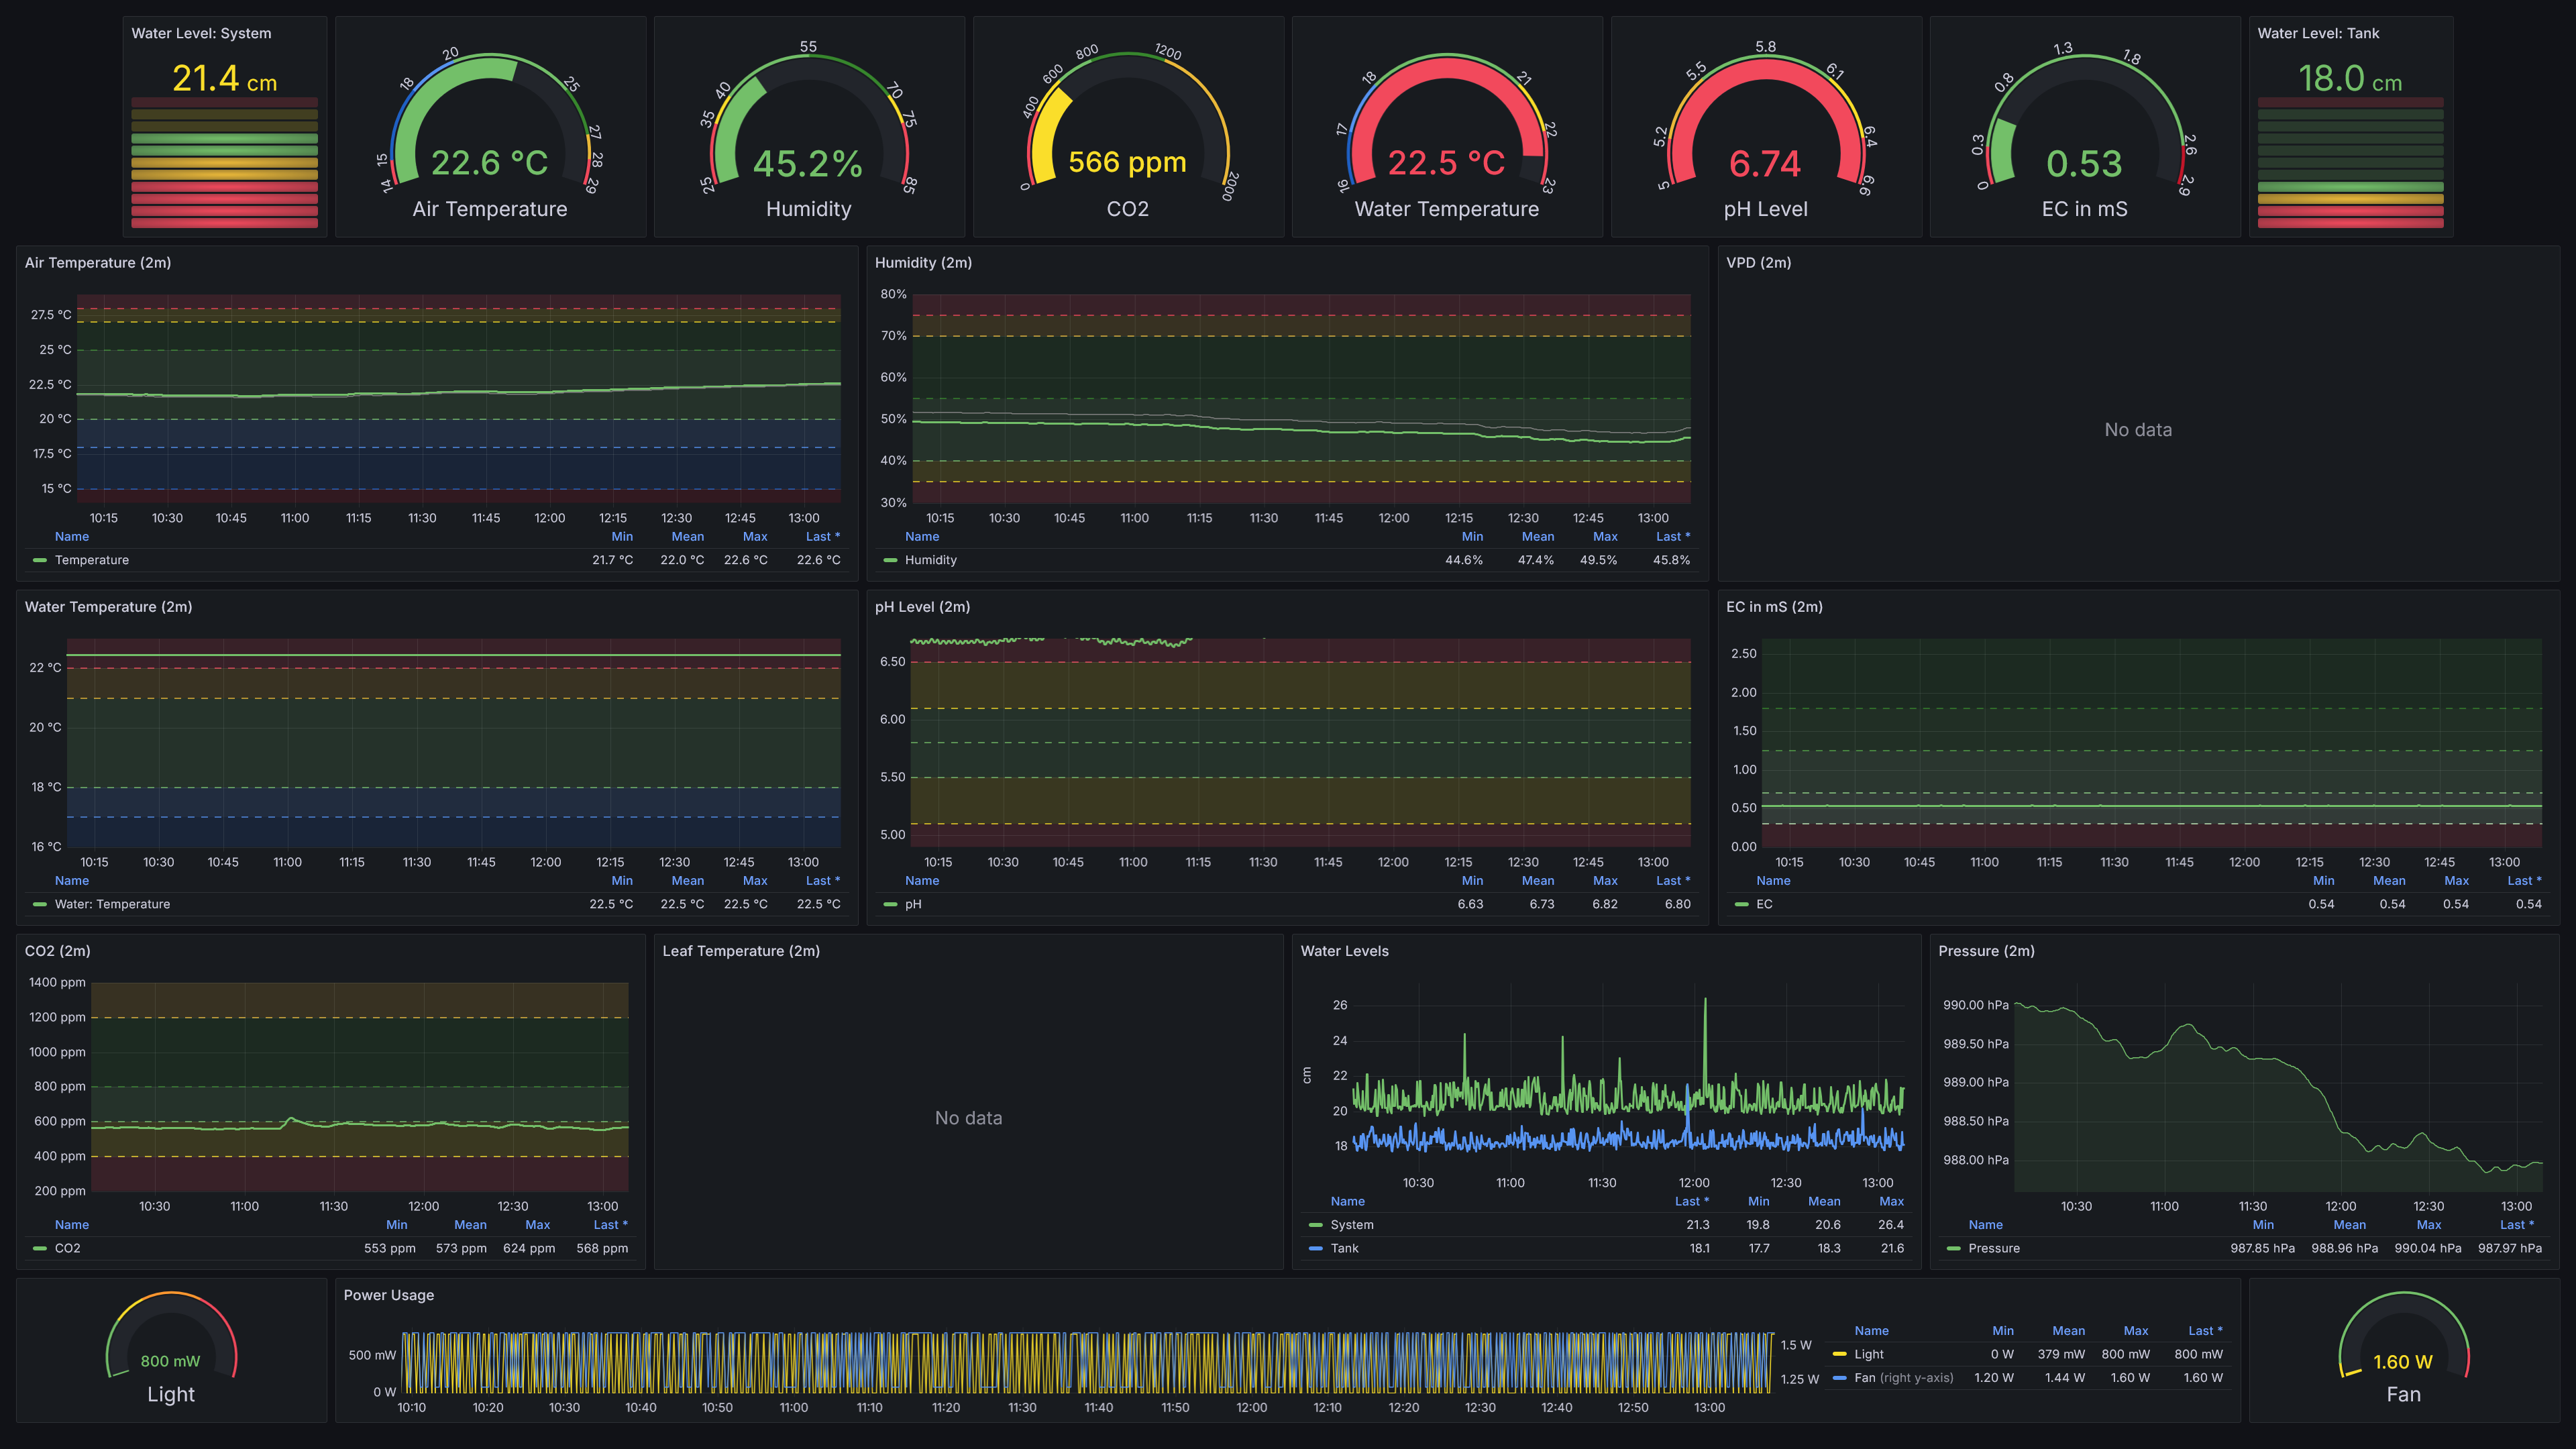
An example dashboard for a full GrowSmart dashboard could looke like this:
 (Please note that this is a screenshot from a currently not used system, which is why some of the value look "unhealthy".)
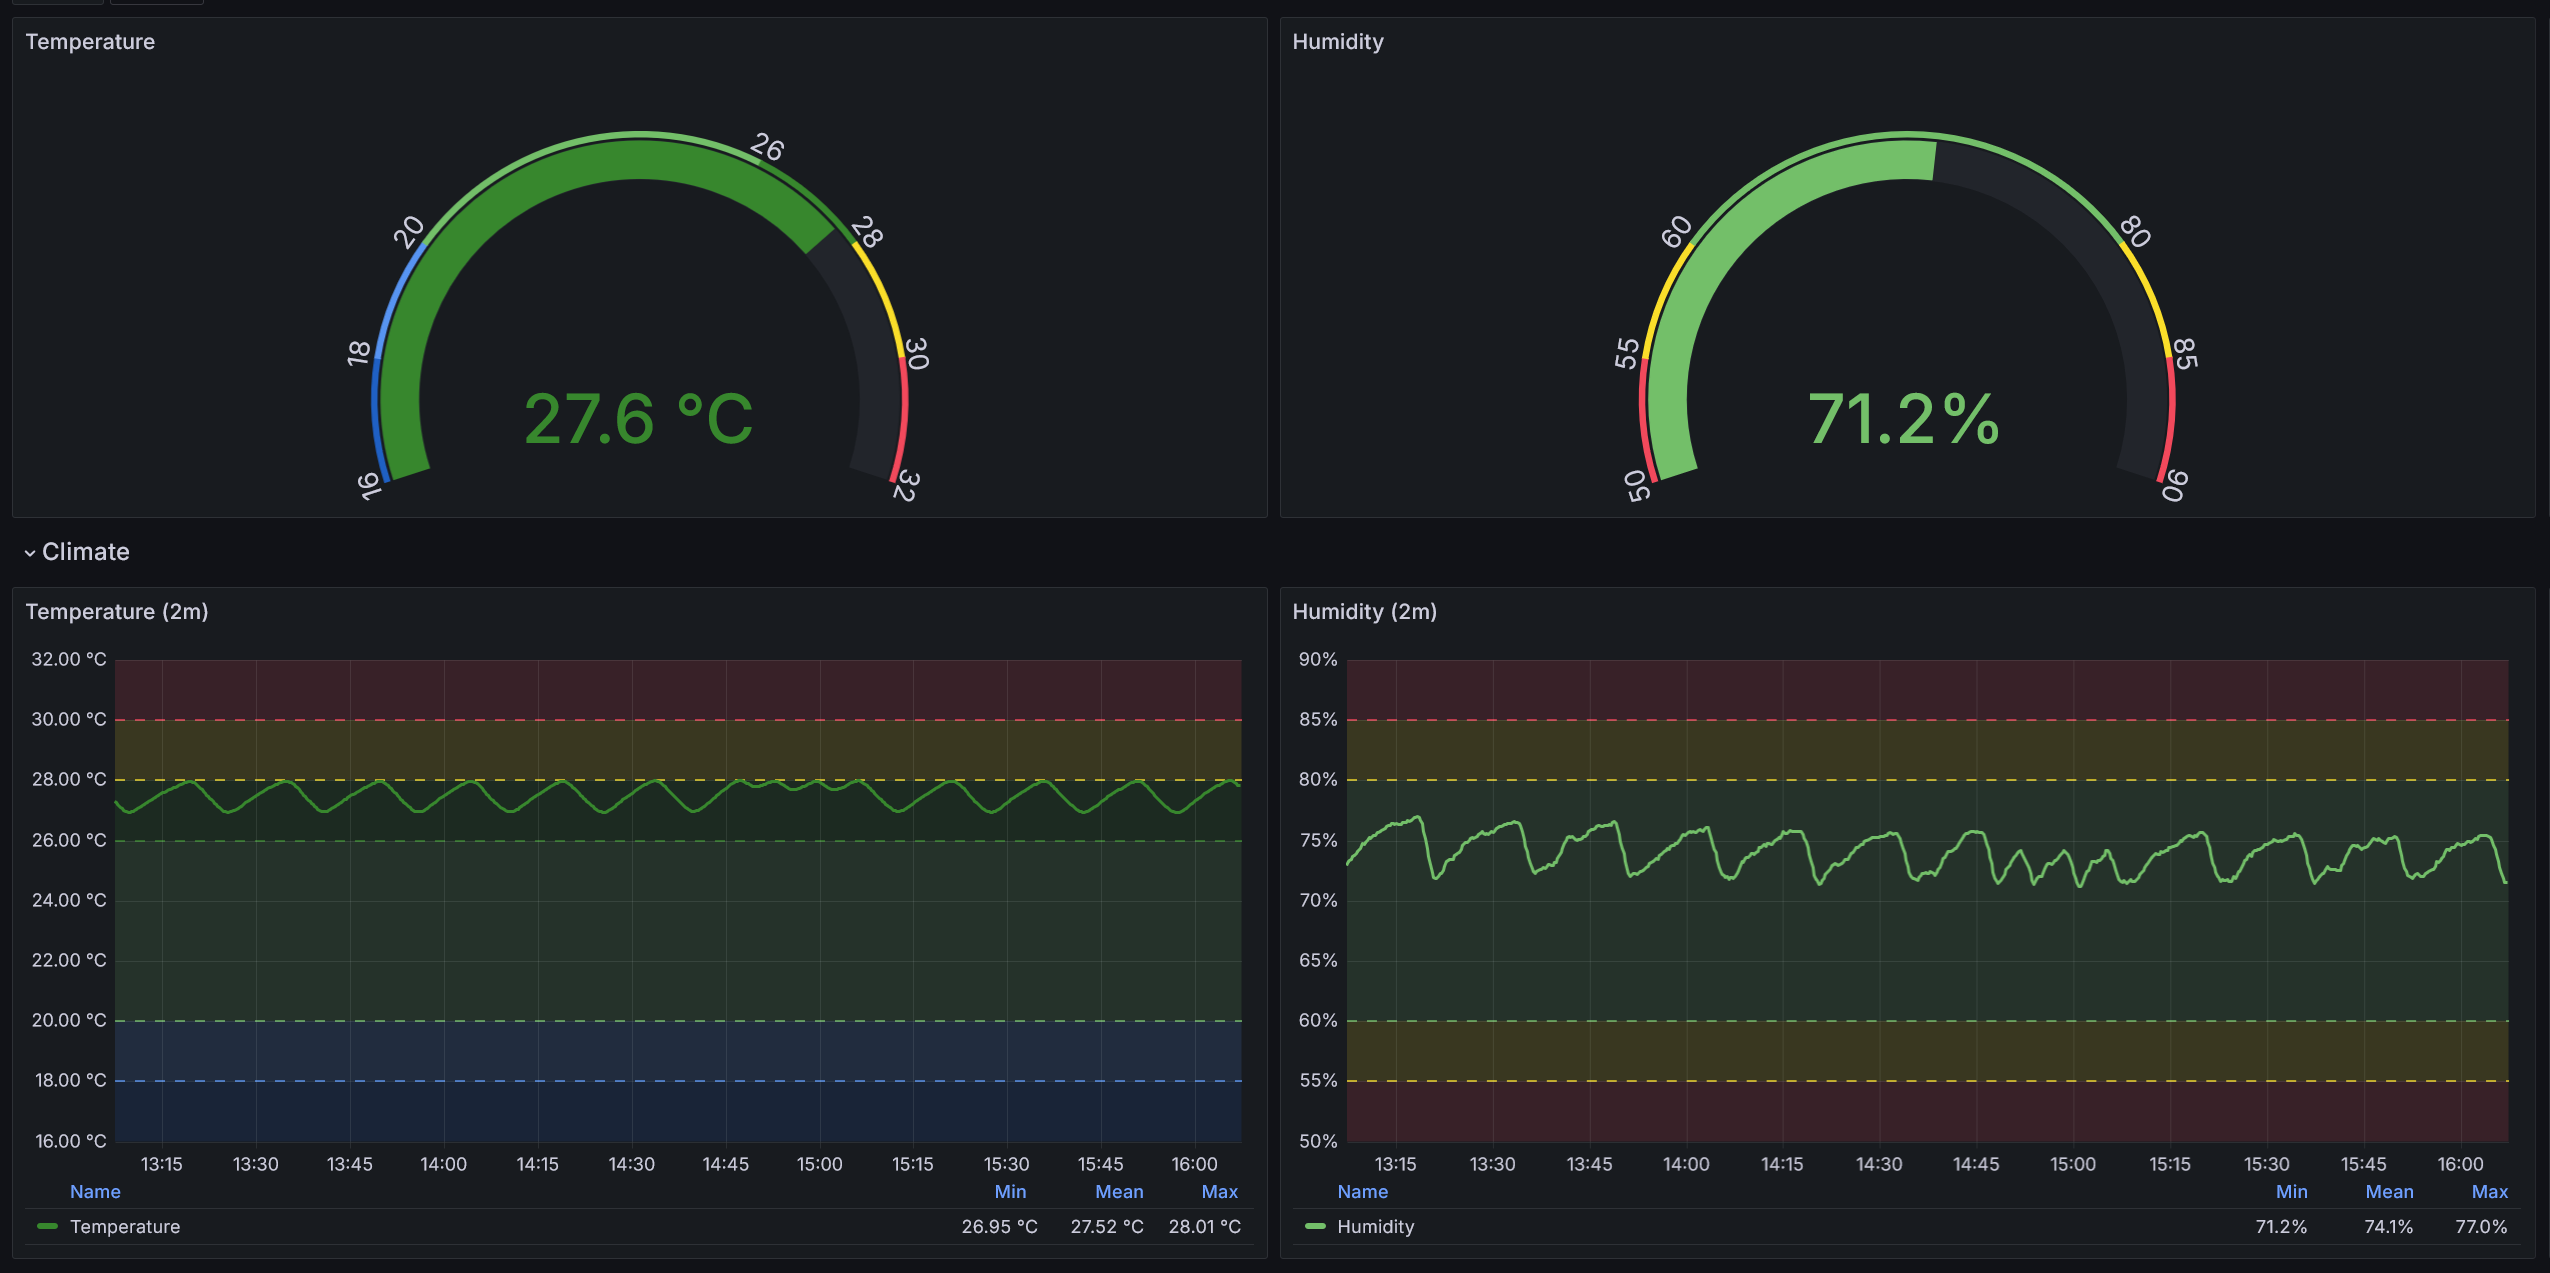
Or you can build a minimal setup with just GrowSmart Core and GrowSmart Air to ge started, e.g. for your propagator box:
 (This is from a currently active system, and you can see that the temperature and relative humidity are very well controlled.)